Introduction:
In the past, a typical planning application had a database layer, an application layer and a reporting layer.
The database served as a permanent data store, the application read the data, applied business logic and displayed it in the reporting layer to the Planners or Business users.
The Business users could only work with the data available to them.
The concept of real-time analytics was not technically possible.
With the advent of new technology, on-demand infrastructure mobilization/scaling, faster network bandwidth etc., it has been made possible to technically deliver “real-time” data (let’s say in the form of KPIs) to the users.
This still does not help the users completely.
Yes, they now have access to the data instantly, but the application layer is still a bottleneck.
The real-time data is sent through a “process” in the application layer and calculates KPIs for the business users to consume. These KPIs, although using real-time data, are not truly ‘real-time’ themselves.
For example
Gross Margin = Sales – COGS (Cost of goods sold).
Gross Margin % = Gross Margin/Sales.
For each Business Unit/Department/Profit Center, the application layer calculates the Gross Margin and Gross Margin % with real-time data and saves the information. Whenever there is a change in the database (either because of addition of plan / actual data), these KPIs are recalculated, saved in the database, and displayed on the reports.
The business users can see the KPIs for their respective Business Unit/Department/Profit Center in the reporting layer. However, let’s assume that the user now wants to combine a few Business Units to examine the instant effect on Gross Margin %. Since the KPIs have already been calculated by Business Unit, the application layer would need to recalculate the KPIs based on the user’s input. Which is why, as mentioned earlier, the KPIs are not truly real-time themselves.
There are several ways to make the KPIs ‘real-time’. Let us look at a couple of possible approaches and examine one that uses a combination of BPC Embedded and HANA.
Planning System - Overview
For our example, the following is representative of the planning system environment for an organization.
Components
SLT Replication server: Moves the ECC to HANA data real-time
Database – HANA
Application Server – BW 7.5
Planning System – BPC 10.1 Embedded
Reporting Tools – Analysis for Office, WEBi, Power BI
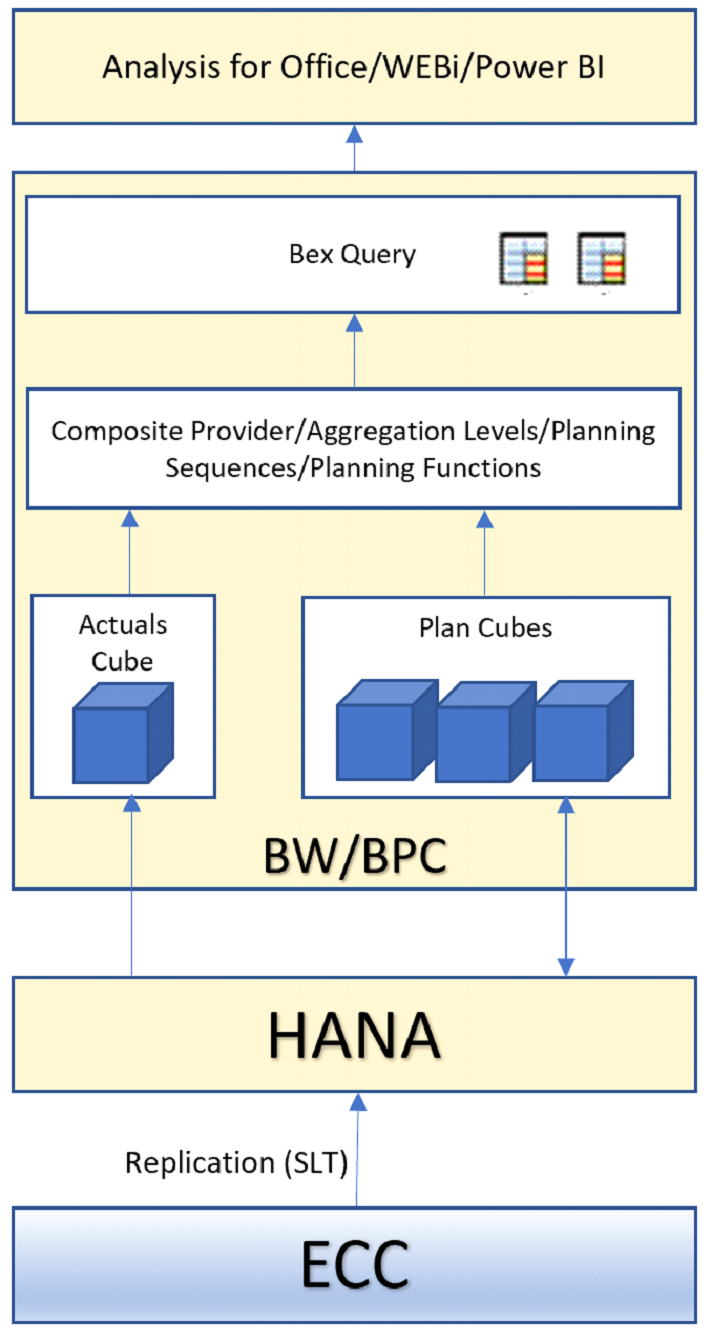
The Business users primarily use ‘Analysis for Office’ (AO) for most of their reporting. Apart from the Actual/Plan analysis, there are several KPIs that they use regularly.
Planning/Forecasting is done on BPC Embedded cubes in the BW system. The Planning cubes are enabled to display a calculated view in the HANA database.
Actual amounts are loaded into HANA from ECC. There is a Calculation View on top of this Actuals data. The Plan and Actual views are combined into a HANA view, which is then consumed by a Composite Provider in the BW layer and then used for reporting. This data is real-time, i.e., any document posted in ECC is instantly available in AO for reporting.
Once the users report on the data, they would be able to build KPI formulae as excel calculations directly in AO and build static KPI dashboards. Rather than this, the goal always was to have a better solution - a ‘real-time’ KPI reporting solution.
Real-Time KPI Reporting:
Modelling in BPC:
One approach to build KPI calculations is to model them in BPC. Here is an overview
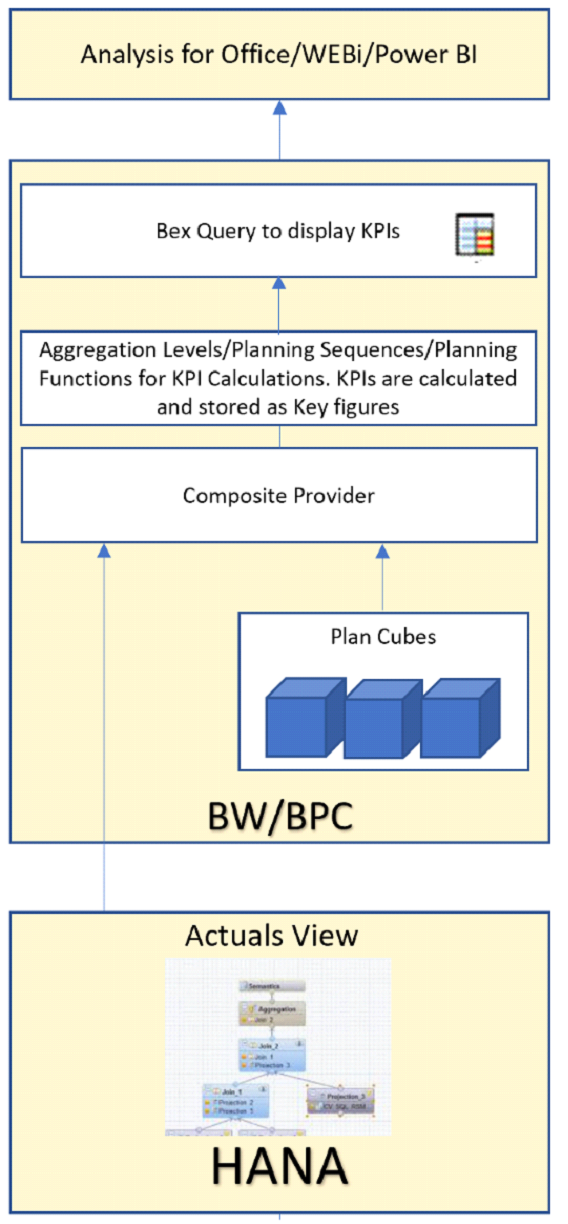
An “Actuals” View sources real-time actuals to a Composite Provider on the BW layer. The Plan cubes are “unioned” on to the Composite Provider.
Aggregation levels are built on top of the Composite Provider. Planning sequences and Planning functions (AMDPs, chosen for better performance) built on the Aggregation levels model the KPI calculations.
The KPI calculations are triggered from AO where the user selects a BU (Business Unit) and a time period. The Planning Function/Sequence picks the user prompts, then runs the KPI calculations, and finally saves the data back to the database while displaying it in AO.
Limitations with this approach:
For every combination of Business Units, for which the users need to view the KPIs, they would have to run the calculation, wait for the calculation to complete, and display back in AO.
Every time the calculation is executed, data gets saved in the database. If there are many Planners/Analysts using the system, it becomes less efficient.
For this solution to be evaluated for further use, it requires a carefully designed process to handle performance (AMDP/Code push-down vs FOX/ABAP function types) and a properly configured model to prevent Planning locks so that multiple users running these calcs for the same Business Unit do not lock themselves out.
Optimal Solution – Modelling in HANA:
The optimal solution for this kind of a requirement, which has been successfully applied for multiple customers, is to harness the processing power of HANA and eliminate any writebacks happening in the database. The solution is completely dynamic and fast and greatly reduces the system processing time end users need to do their analysis. Here is an overview of the solution.
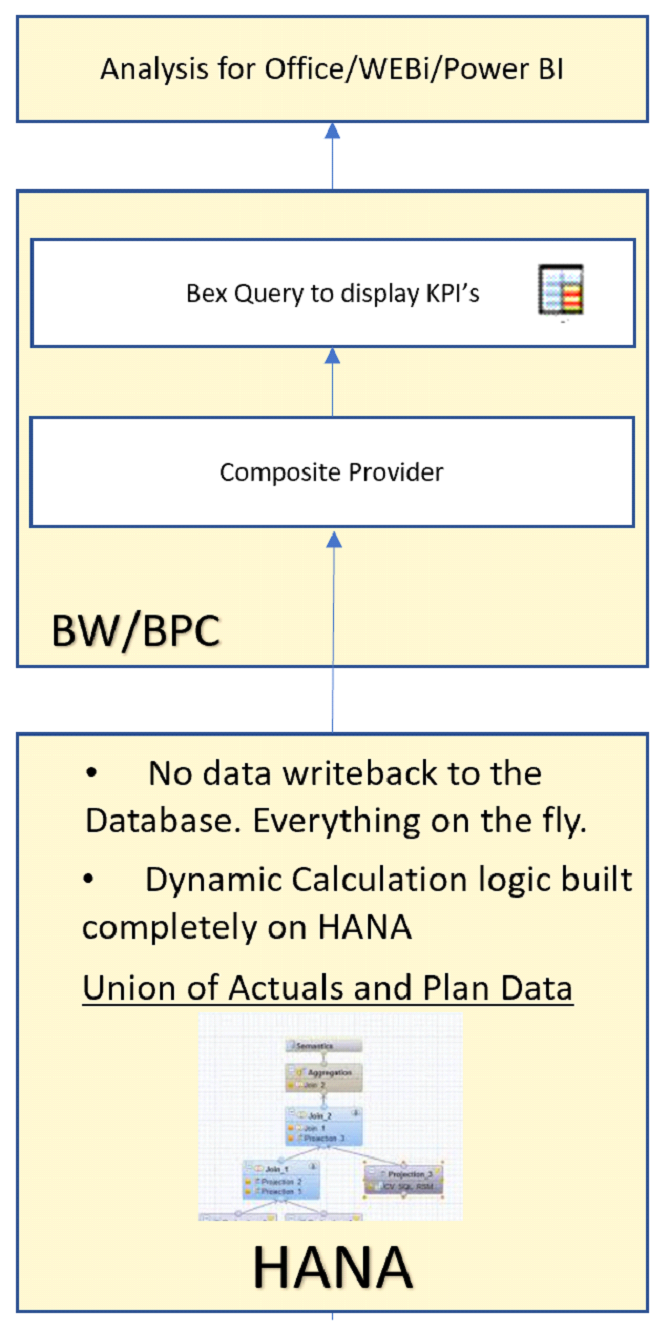
The entire calculation logic is moved to the HANA database. Calculation views are built on the real time data available in the database and the calculations are modelled. The KPI calculations can be made on specific key figures or linked to a new dimension (say KPIs), with a list of members, to make it user-friendly.
NOTE: Any type of complex logic can be built and there is no data writeback done to the database. Custom reporting hierarchies for management reporting and other custom calculations can also be dynamically modelled.
The final calculated data is pushed to a composite provider in the BW layer which is then displayed directly in AO or through Bex Queries for Canned/Formatted reports.
Benefits of this approach:
The users do not have to pass any parameters in AO. All they do is use the regular AO functionality for analysis, drag & drop key figures (or custom dimensions as mentioned above) on to the report layout. A query gets generated automatically in the backend and is passed on to the HANA database. The ‘Calc’ view picks up the parameters from AO, dynamically runs the calculations, and passes the data back to the BW layer as well as AO.
Important: For this to work, the HANA calculation view must be effectively designed. The filters from AO need to be passed down to the lowest level of the HANA calc view, and if this is not done, the performance will be negatively impacted. There is a difference in methodology between the data being queried on the HANA database and the handshake that happens between AO and HANA.The maximum time taken typically during the query is when the data transfers between HANA and Excel. It is very important that these are efficiently designed for maximum performance.
Also, in this approach, there are no concurrent locks and no data writeback. The users have the flexibility to pick any number of dimensions for analysis. This solution is very effective and fast when properly configured and has been successfully implemented for many customers.
Summary:
Over the years, the gap between the database layer and the application layer has narrowed. Users do not visualize planning/analytics tools as a distributed network of multiple systems, but as one “system” that provides fast, on-demand data for better decision-making. Using the power of HANA and BPC Embedded, developers are well-equipped to serve the needs of constantly changing businesses.
In this blog I have outlined a very high-level approach towards building a dynamic KPI model using the tools indicated. It is important to also note that BPC Embedded and HANA are certainly tools that will go a long way and can deliver similar capabilities even in a hybrid model with SAC as the reporting interface.
Powered by Froala Editor

Write A Comment